

Last month, Mark Ritson wrote about the creator economy in his weekly column for The Drum. In it, he talked about the massively over-inflated claim that “brands earn $5.78 for every dollar spent on influencer marketing” from Influencer Marketing Hub.
What was particularly striking was how he described that figure:
“It is denominated in “earned media value.” EMV, for the uninitiated, is what you get when you count up impressions you did not pay for, multiply them by a rate card you just invented and declare the result in financial terms you don’t really understand.
It is not money. Nobody banks EMV. No CFO has ever paid a dividend from or for it.
It is astrology with a wonky spreadsheet attached.”
For those of us who’ve worked in sponsorship for more than 5 minutes, I’m sure this is ringing some bells. Because we have our own version: AVE, or Advertising Value Equivalent (sometimes MVE, for Media Value Equivalent).
In lieu of a standardised way to measure the effectiveness of sponsorships, AVE became the one number the sponsorship sector coalesced around, despite it being something of an open secret that it’s completely made up.
But I’d argue that, more than being useless, it’s actually dangerous and hampers efforts to understand what a deal does for a brand’s bottom line.
Turns out it’s not just me that thinks that.
PR invented AVE, then rejected it
In 2010, the trade body for communications measurement, AMEC, published the Barcelona Principles: seven statements about how to measure the value of public relations. One of them rejected the metric the PR industry had leaned on for decades. Advertising value equivalency, the principle stated, measures the cost of media space rather than the value of the work and should not be used to value PR. Fifteen years and three revisions later, that position has not moved. The industry that invented AVE has spent a decade and a half telling people to stop using it.
Sponsorship never got the memo. Open almost any post-campaign report for a shirt deal or a stadium naming right and you will find a large number with a pound sign in front of it, labelled media value or media ROI, built the same way PR built its AVEs. Sponsorship borrowed the metric from PR and kept it after PR threw it out.
AVE came out of PR’s need to look as measurable as advertising. Advertising could point to a rate card and say what its space had cost. PR coverage had no price attached, so it looked soft next to a media plan. The fix was to borrow advertising’s unit. If a story ran across ten column inches, and the paper charged fifteen pounds a column inch for advertising, the coverage was “worth” a hundred and fifty pounds. Add up every clipping that way and you had a number to put in front of a client.
It was never a serious method. Measurement researchers, including Jim Macnamara and Katie Paine, have rejected it for years, and academic reviews of its history find it was never given credibility by serious practitioners. It survived because it was convenient.
Sponsorship adapted the same logic for the screen. Count the seconds a brand’s logo is in vision across a broadcast. Multiply by the cost of buying that airtime as an advertisement. The clipping became the logo, and the column inch became the broadcast second.
Seconds on screen times the ad rate
The formula is size times rate. In print PR it is column inches times the advertising rate per inch; in broadcast, seconds of airtime times the rate per second. In sponsorship, it is seconds of logo exposure times the cost of the equivalent television advertisement.
Then the adjustments start. Some vendors discount for a logo being smaller or less prominent than a full advertisement. Others multiply the number up, on the argument that earned coverage is more credible than paid, with multipliers that have run from two times to as much as ten. AMEC’s own guidance is blunt on this, that such multipliers should never be applied unless the effect has been proven to exist in the specific case, which it almost never is.
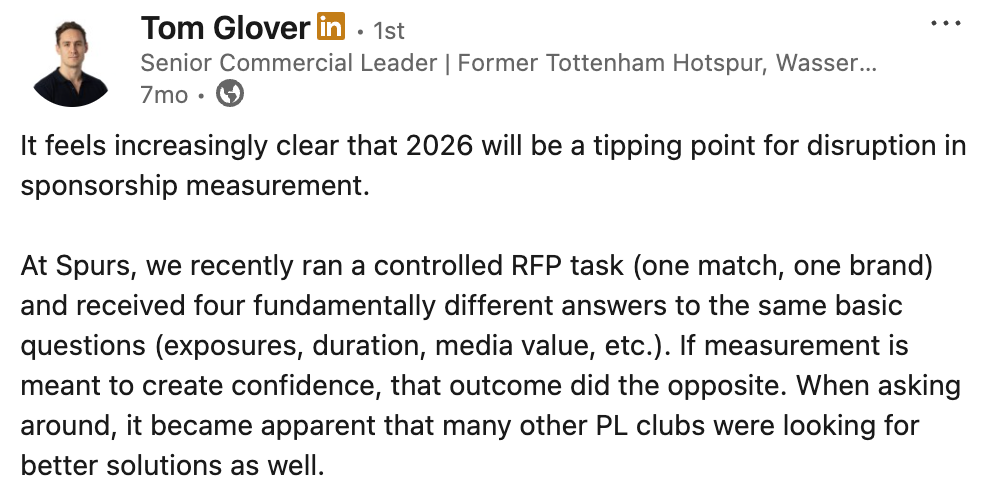
As Tom’s post shows, there is no standard. Two agencies can value the same exposure at wildly different figures and both call it AVE. But the problems don’t stop there.
Suppose a report credits a shirt sponsor with three hours of cumulative logo exposure across a season, counting matches, highlights and clips. Three hours is 10,800 seconds. Price it against a thirty-second spot at two thousand pounds a second, and you have 21.6 million pounds of “media value” from one deal. Set that against a five million pound fee, and the slide shows better than four to one.
The rate card is a fiction
Two things are wrong with that number. The first is the rate card. The price used to value the exposure is a list price, and almost nobody pays the list price for television. Airtime is bought through negotiation and auction, often at a heavy discount to the published rate. Pricing sponsorship exposure against the rate card values it against a number advertisers themselves do not pay, so the benchmark is inflated before you start.
The second is the equivalence. A thirty-second television advertisement and a logo on a shirt are not the same product measured in different amounts. The advertisement has sound, a story, full-frame branding, a message and often a reason to act. The logo is a badge in the corner of a wide shot while the viewer watches something else. Counting them both in seconds and pricing them the same treats a sentence and a billboard as equal because they take the same time to pass.
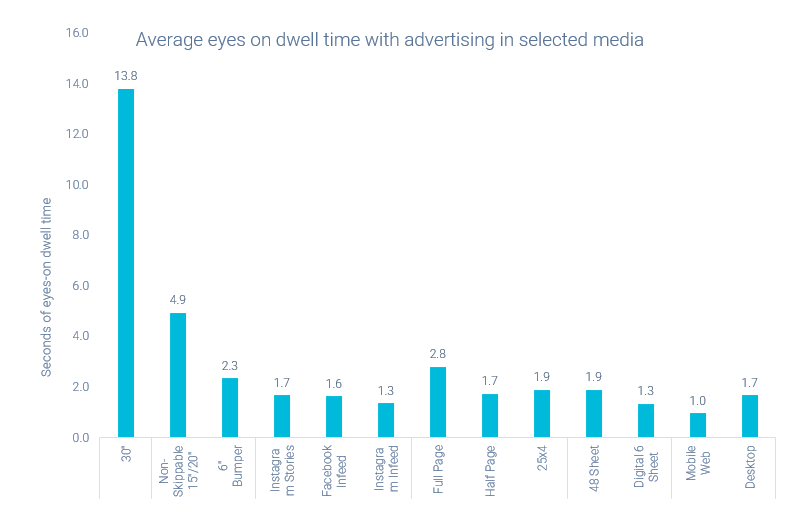
Time in vision is not attention, which makes the equivalence worse still. The research of Lumen and Dr Karen Nelson-Field on attention shows that much on-screen advertising gets little or no active attention and that how much of the screen an execution occupies and for how long it is actually looked at predicts whether it has any effect at all.
A small logo competing with live sport for the viewer’s eye is close to the worst case. Orlando Wood’s work on the features that earn attention, characters and story and place and music points the same way, because a static logo has none of them.
Why a discredited number survives
If AVE is this weak, why is it everywhere?
My sense is that it’s because it produces one satisfyingly large number. A CFO reviewing a marketing budget wants a figure, and a single large value is easier to put in a board pack than a paragraph about mental availability.
The number is nearly always big, which suits the rights-holder selling the property, the sponsorship manager defending the spend, and the agency reporting on the work. Everyone in the chain has a reason to like a large number, and nobody has a reason to interrogate it.
It looks rigorous too, with decimal places and a methodology document behind it, which lends the appearance of measurement even when the thing measured is invented. There are vendors whose whole business is producing it. Set against all that, “we raised mental availability among category buyers” sounds like an excuse.
AVE is a cost, not a return
Take the media value, divide by the fee, and report the ratio. That is how AVE turns into ROI, and how 21.6 million against a five million fee becomes better than four to one, and a deal starts to look like a triumph.
It is not a return, because AVE is not revenue. Return on investment compares what you got back with what you put in, and what you get back has to be real profit. Anything else is not ROI (if you don’t believe me, ask the Harvard Business Review).
In the Sponsorship Effect’s analysis of 92 award-winning cases, only two reported profit. The dataset does not yet record what sponsors paid for their rights, which means genuine ROI cannot be calculated from it at all. An industry that reports four-to-one returns as a matter of routine turns out, when you code its best-documented work, to almost never measure profit and to rarely record spend.
Reach, frequency, and a coefficient for attention
Binning AVE needs to happen straight away. But could something else replace it?
I’ve long argued that sponsorship needs to be held in the same analytical frame as advertising, and advertising doesn’t value a TV campaign by asking what the airtime cost is. It measures reach and frequency, how many people saw the work and how often. In Binet and Field’s analysis of the IPA Databank, reach accounted for around 83% of the variation in media effectiveness. Reach is the currency the rest of the industry trades in, and sponsorship exposure can enter the same currency. Count the people reached and the frequency of exposure, and you have an input that fits alongside television ratings and digital impressions rather than a pound value that fits nowhere.
Charlie Dundas of GSIQ makes exactly this case in the Sponsorship Effect. Exposure on its own tells you reach and frequency, but its real power comes when it is treated as a clean input into wider measurement frameworks and econometric models alongside every other channel.
Raw reach and frequency flatten real differences, though. A logo on a perimeter board in a wide shot, a brand woven into the broadcast furniture, and a fan spending twenty minutes inside a branded activation are not equal, even when the raw exposure count matches. A coefficient is what closes that gap, a weighting on reach and frequency that adjusts for the quality of attention the exposure earned.
The attention research supplies the raw material: Nelson-Field on screen coverage and active attention, Wood on the features that generate it, and the plain difference between a glance and fixed attention. Two brands with identical seconds in vision should not score the same if one was looked at and the other was wallpaper.
When it comes to sponsorship, a coefficient has a second (and potentially more important) job. A sponsorship creates opportunities for fame-building activations. It primes emotion through moments advertising cannot manufacture, opens hospitality and business-to-business access, and gives staff something to belong to.
Most of that list is what Binet and Field identify as the drivers of long-term effect: reach, emotion, fame, and mental availability; a logo-seconds figure captures none of it.
If the sector were to replace AVE with another metric, it would need a coefficient for reach and frequency that takes account of where the partnership does these other jobs vs where a badge is in a wide shot for half a second.
It would, ideally, also be able to take into account the behaviours and beliefs of different audiences, because a well-activated partnership creates an association between a brand and a property that people genuinely care about.
Just last week, Gemba launched its A Question of Impact report. It’s a great piece of work looking at top-of-funnel results from 300+ sponsorships over 15 years. One of its findings is that women’s sponsorships were significantly more likely to increase consideration for a brand than men’s sponsorships.
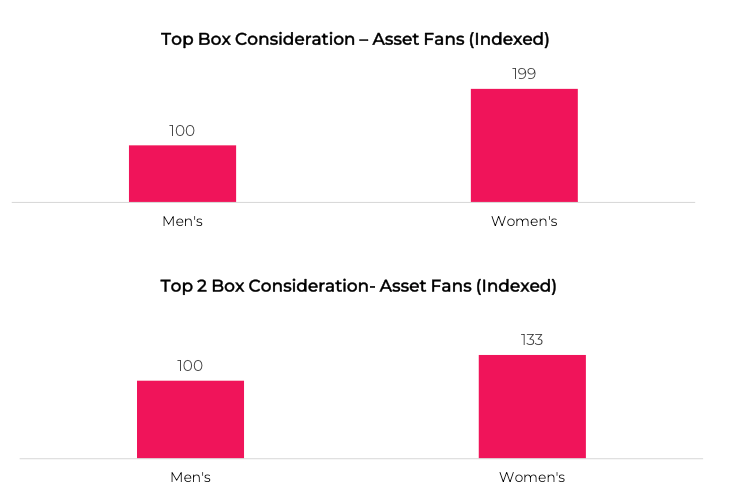
Much more is needed to understand exactly why this is the case. But the point is that a traditional AVE calculation would downgrade the value of reach and frequency for women’s sports, because the ad rates are lower. This research indicates that the reach and frequency gained from a women’s sponsorship could be up to 2x more valuable than the reach and frequency of a men’s sponsorship.
Going further, there are likely to be differences in the receptiveness to sponsors of different fan bases, in different sports, and of different teams. And a coefficient that captures all of that would be a true game-changer.
But the fact is nobody has a validated coefficient that turns attention quality and partnership effects into a single weighting.
For now we do have exposure, reach and frequency. Brand tracking and category entry point analysis show whether awareness and mental availability moved. Digital, social and spatial analytics show how behaviour has changed. And econometrics isolates the contribution to sales.
The choice the sector needs to make
A cost is not a value, however many decimal places you give it, and PR worked this out fifteen years ago.
Sponsorship can keep reporting indefensible media values, or it can start measuring what the fee actually buys: people reached, attention earned, meaning transferred, and, in time, sales moved.
I would rather chuck AVE in the bin and defend the second kind of number, even if it comes out smaller.